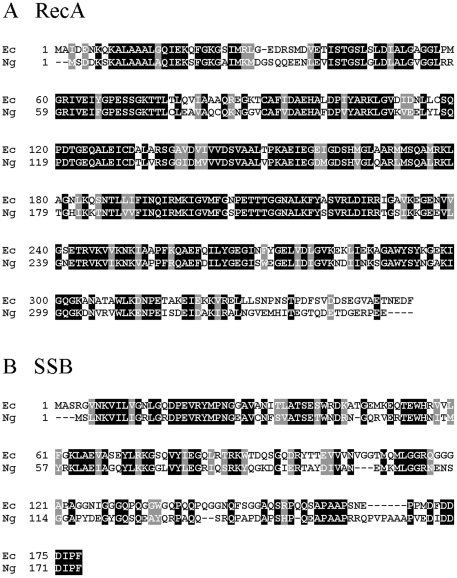
Figure 1. Amino acid sequence alignments of RecA and SSB proteins from E. coli (Ec) and N. gonorrhoeae (Ng).
Identical residues are boxed in black; similar residues are boxed in grey. Dashes represent gaps introduced to optimize sequence alignment. A. Alignment of RecA proteins. B. Alignment of SSB proteins.

