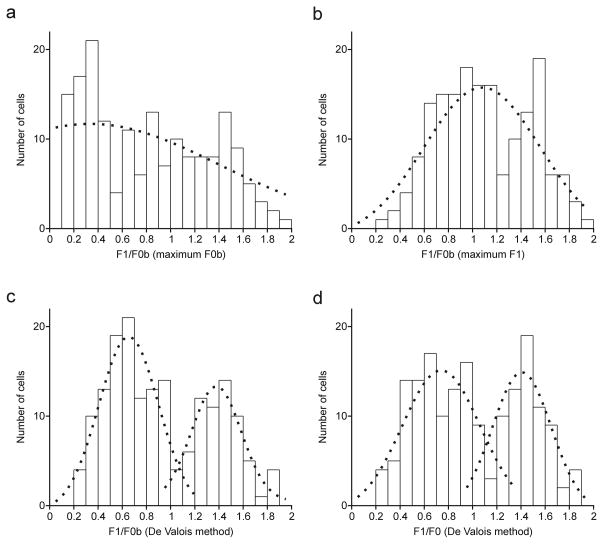
Figure 2.
Distribution of response linearity (F1/F0) fitted with Gaussian functions (dotted line) and computed by four different methods. a. F1/F0b measured at the spatial frequency that generated the maximum F0b response. b. F1/F0b measured at the spatial frequency that generated the maximum F1 response. c. F1/F0b measured as an average of F1 and F0b over the three spatial frequencies that generated the largest combined F1 and F0b responses. d. Same as c but after subtracting the spontaneous firing rate.

