
Fig. 6.
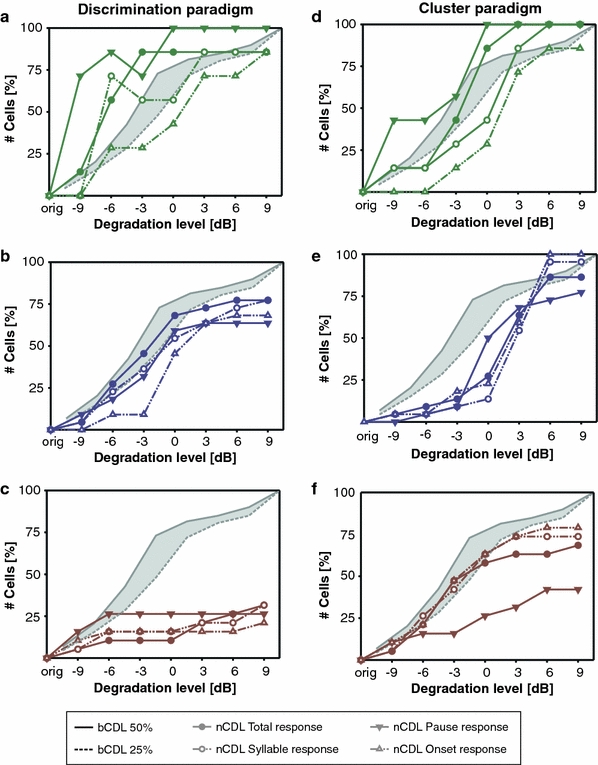
Neuronal critical degradation levels for isolated response components (i.e., total response, syllable response, pause response and onset response—see inset). a–c Discrimination analysis. The colored curves (see inset) indicate the percentage of cells (ordinate) for which the distances could be discriminated with an accuracy rate of at least 95%. a Receptor cells, b local and c ascending neurons are shown separately. To ease comparison, the cumulative percentages of bCDLs are indicated in gray. d–f Cluster analysis. Frequency of assignments to the ‘noise’ class (ordinate) according to the information-based clustering algorithm in dependence of different degradation levels (abscissa). d Receptor cells, e local and f ascending neurons. Sampling size for b and c: REC = 7, LN = 22, AN = 19