Figure 3.
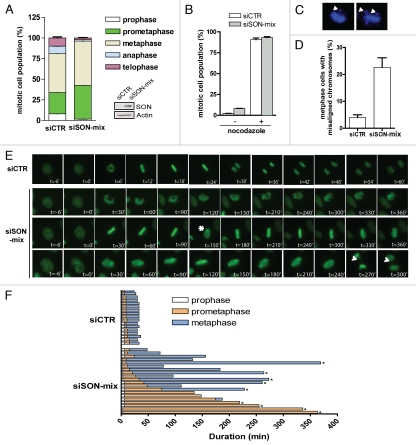
SON promotes mitotic fidelity. (A) Quantification of mitotic cells in different stages of mitosis: prophase, prometaphase, metaphase, anaphase and telophase. Note that the mitotic index is around five times higher in SON-depleted cells. (B) Microtubule depolymerisation arrested SON-depleted cells. siRNA-treated cells were incubated in 20 ng ml−1 nocodazole or DMSO for 16 hr. Thereafter cells were harvested, fixed and processed to evaluate the percentage of mitotic cells. (C and D) Misaligned chromosomes in SON-depleted cells. Representative figures showing misaligned chromosomes in SON-depleted cells (C). Quantification of cells with chromosome congression defects. HeLa cells transfected with indicated siRNAs were processed and metaphase cells were visualized by DAPI staining. Cells with misaligned chromosomes were scored, n = 100 (D). (E and F) SON depletion delays mitotic progression. Representative images of control (siCTR) or SON-specific (siSON-mix) siRNA-treated cells from nuclear envelope breakdown to anaphase onset (E). Live cells pretreated with indicated siRNAs were followed over a 8-hr period and the durations of prophase, prometaphase and metaphase are illustrated. SON-depleted cells often display cycles of chromosome condensation and decondensation (marked by asterisk) and internuclear bridges during anaphase can be observed (marked by arrow). (F). The asterisks are indicative of cells that did not go onto anaphase.

