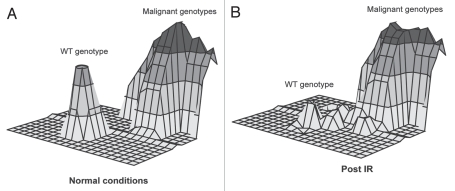
Figure 3.
Adaptive landscape of stem cell populations under normal conditions and in irradiated or aging environments. The x- and y-axes represent the potential genetic and epigenetic diversity. Adjacent points on the X-Y landscape correspond to more similar (epi)genotypes. The z-axis (vertical axis with peaks above the plane) represents fitness.

