
Figure 2.
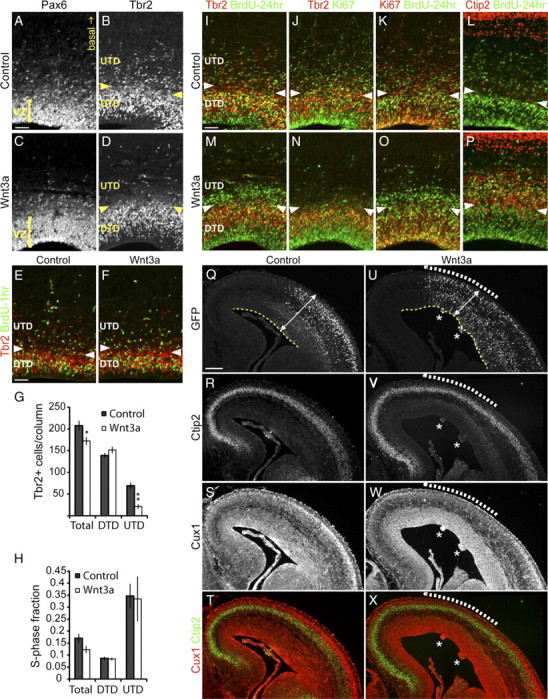
Wnt3a promotes expansion of RG and differentiation of IPs. Brains electroporated at E13.5 were analyzed at E16.5 for the distribution of progenitors and neurons by immunolabeling. A, C, Analysis of RG distribution with Pax6 immunolabeling. Yellow bracket indicates the thickness of the ventricular zone. In B, D–F, and I–P, the boundary between the UTD and DTD subpopulations of Tbr2+ IPs is demarcated by the pairs of yellow or white arrowheads. B, D, Examination of IP distribution with Tbr2 immunolabeling. E–H, Analysis of the numbers and S-phase fraction of IPs. BrdU was injected 1 h before harvest for S-phase fraction analysis. E, F, Representative samples used for quantification of Tbr2+ cells numbers in G and the S-phase fraction of Tbr2+ cell populations in H with Tbr2 and BrdU immunolabeling. I–P, Lineage tracing of progenitors in S-phase with BrdU injected at E15.5, 24 h before harvest and analysis at E16.5. I, M, Coimmunolabeling for BrdU and Tbr2 to determine the localization of IPs born at E15.5. J,K and N,O, Triple immunolabeling for BrdU, Ki67, and Tbr2 to analyze the cell cycle state of BrdU-labeled cells. L, P, Coimmunolabeling for BrdU and Ctip2 to determine the differentiation state of BrdU-labeled cells. Q–X, Triple immunolabeling for GFP, Ctip2, and Cux1 to determine the effect of Wnt3a on neuron production. Q, U, GFP immunolabeling shows the extent of plasmid expression. White dashed lines in U–X indicate the region in which Ctip2 and Cux1 expression are most strongly affected. Q, U, Analysis of neocortex morphology. White double-ended arrows and yellow dashed lines indicate the thickness and trace the length of the neocortex, respectively. Nodules positive for ectopic Ctip2 is indicated with a white asterisk in U–X. Scale bars: A, E, I, 50 μm; Q, 200 μm. Error bars represent SEM. In G, *p < 0.05 and **p < 0.001.