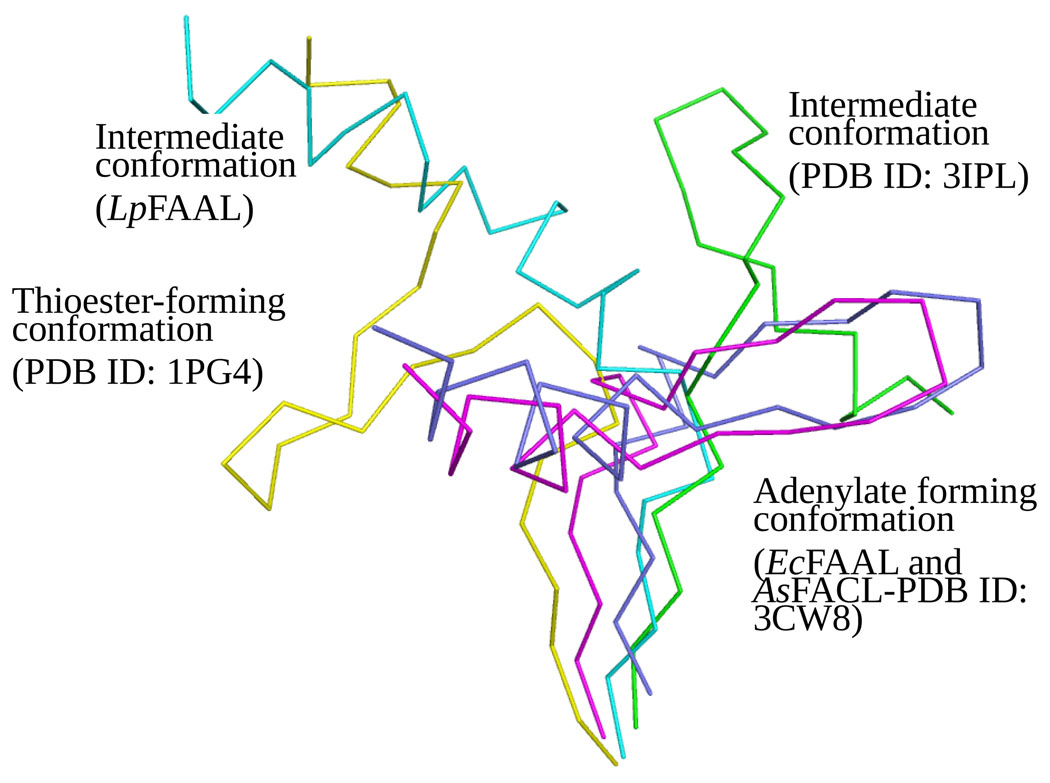
Figure 4.
Comparison of hinge regions when the N-terminal domains (not shown) of FAAL and FACL structures are overlaid. Adenylate forming conformation from EcFAAL and AsFACL (3CW8) are colored in magenta and blue, respectively. Intermediate conformations from LpFAAL and FACL (3IPL) are colored in cyan and green, respectively. CoA binding conformation from FACL (1PG4) colored in yellow. LpFAAL N-terminal domain is colored in grey.

