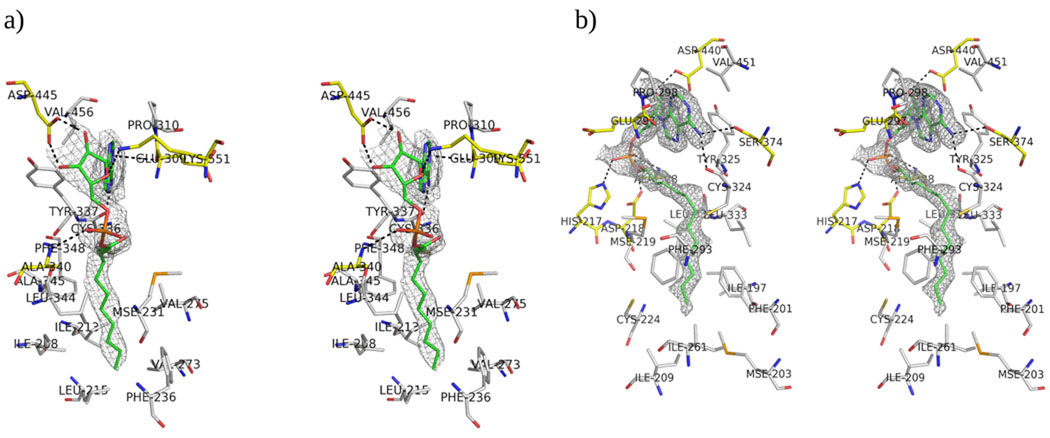
Figure 6.
Stereo view of acyl adenylate and FAAL residues. a) Stereo view of interactions between acyl adenylate and EcFAAL residues. b) Stereo view of interactions between acyl adenylate and LpFAAL residues. The residues that form hydrogen bonds with acyl adenylate are colored yellow and the residues that form the hydrophobic pockets are colored gray. Both a and b show the Sigma weighted 2Fo-Fc electron density contoured at 1σ level around the acyl adenylates.

