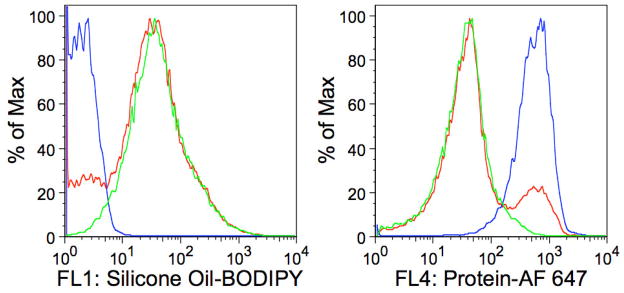
Figure 3.
Fluorescence histograms of analyzed particles. A) BODIPY fluorescence B) AF 647 fluorescence. Histograms are representations of the data from Figure 2 with the blue line representing the BSA-AF 647 aggregate suspension; the green line representing the silicone oil-BODIPY droplets with adsorbed BSA-AF 647; and the red line representing the mixture of the BSA-AF 647 aggregate suspension and silicone oil-BODIPY droplets with adsorbed BSA-AF 647. The abscissas represent fluorescence intensity measured with FL1 detector (530/30 nm) or FL4 detector (661/16 nm) whereas the ordinate represents number of events normalized to the maximum number of events recorded for any single fluorescence intensity (percent maximum events).

