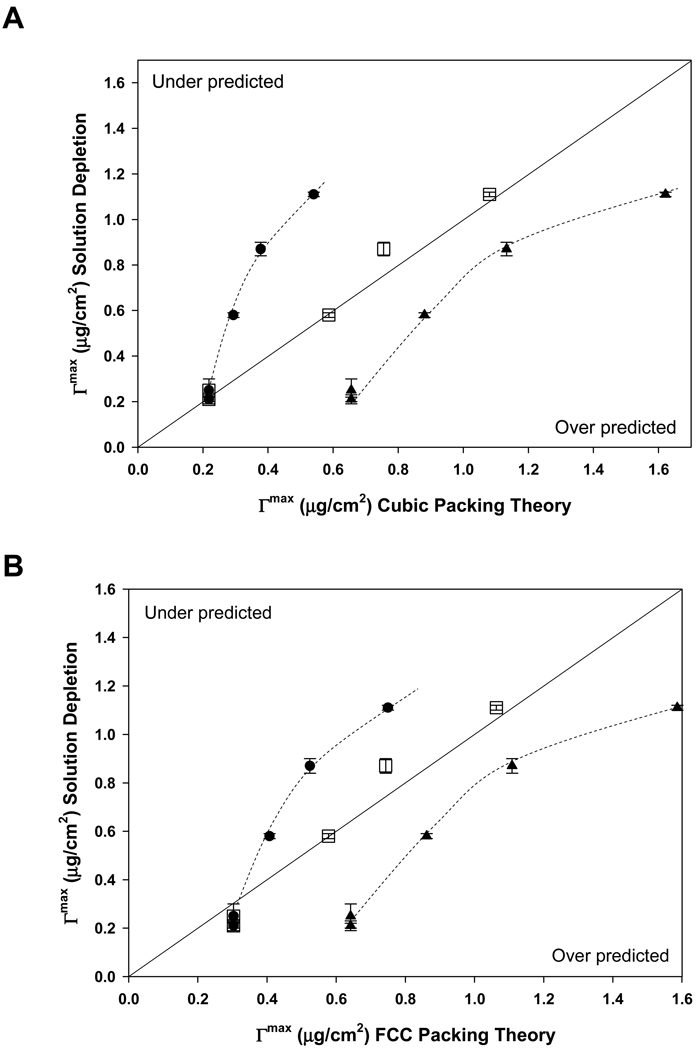
Figure 3.
Adsorbent capacity of hydrophobized glass particles measured by the solution-depletion method (ordinate) compared to theoretical capacity (abscissa), corresponding to cubic packing (Panel A) of hydrated proteins (see Fig. 1) or face-centered-cubic packing (FCC, Panel B). The 45° bisecting line represents perfect correlation of experiment and theory, with under prediction falling in the upper quadrant and over prediction falling in the lower quadrant (see annotations). Assumption of one adsorbed layer under predicted measurement for proteins larger than HSA (filled circles) whereas a three-layer model over predicted measurement for all proteins. Judicious combination of layer models, one layer for HSA and two layers for IgG, Fib, and IgM, predicts adsorbent capacity nearly exactly (open squares). Dotted lines through experimental data are guides to the eye. Outcomes for cubic packing (Panel A) were very similar to that of FCC packing (Panel B). Error bars represent experimental uncertainty in solution-depletion measurements.

