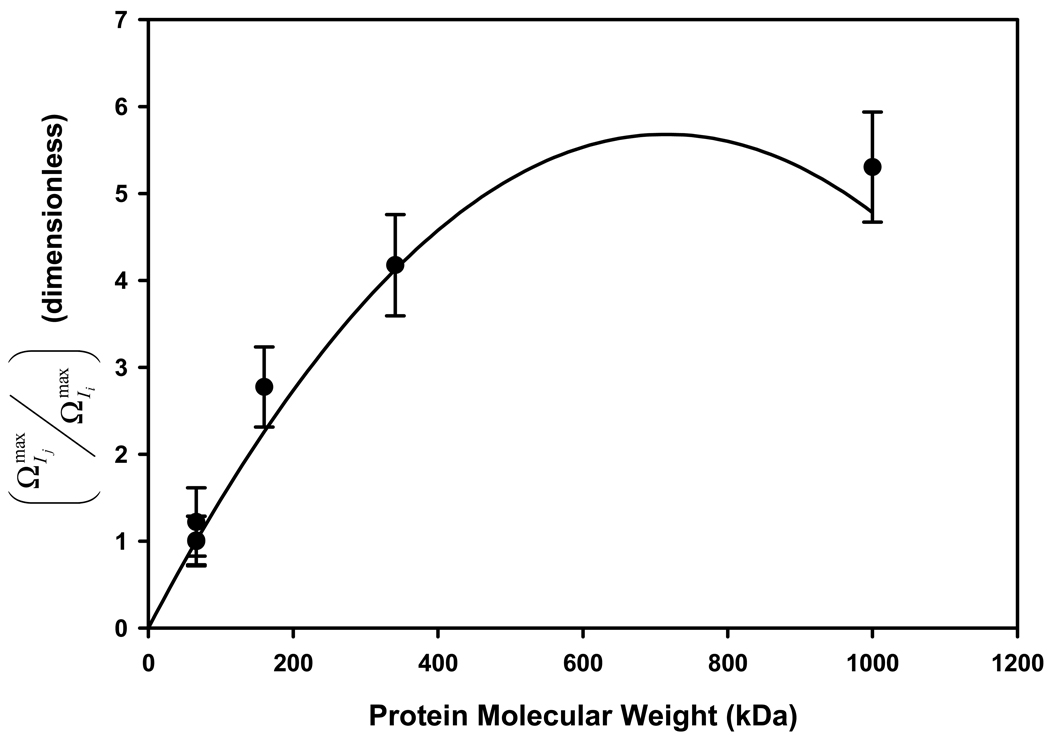
Figure 7.
Thickness of different proteins adsorbed to hydrophobized glass particles deduced from adsorbent capacity measurements by the solution-depletion method (ordinate) as a function of protein molecular weight (see Table 1 for protein identity). Notice that thickness of adsorbed IgM (1000 kDa) is nearly 5X greater than HSA (66 kDa) at surface saturation. An approximate relationship based on face-centered-cubic packing of adsorbed protein correlates with experimental data (line). Error bars represent experimental uncertainty in solution-depletion measurements propagated into calculated thickness ratio.

