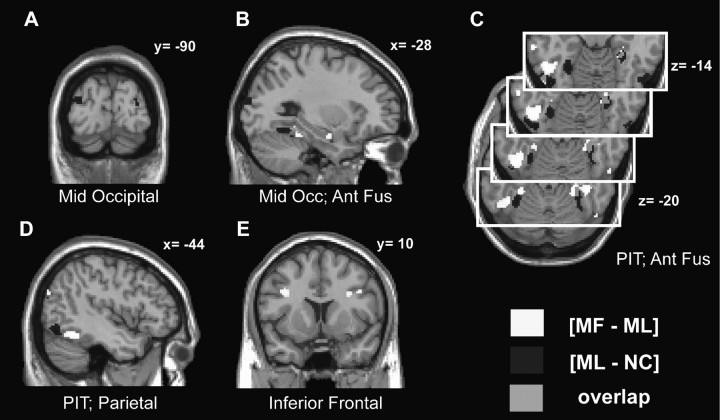
Figure 3.
Clusters activated by “collinearity” and “meaning.” Suprathreshold regions obtained with the contrast [MF–ML] are shown in white and those identified by the contrast [ML–NC] in dark gray. Regions commonly activated are shown in light gray. SPMs are displayed on coronal (A and E), sagittal (B and D), and transversal (C) slices, and show activations in middle occipital cortex (A and B), anterior fusiform gyrus (B and C), pIT gyrus (PIT; C and D), parietal lobule (D), and inferior frontal gyrus (E). All activations are shown at a threshold of P < 0.001, uncorrected, for display purposes, but only those significant at P < 0.05 (Bonferroni or SVC if a strong prior hypothesis) are discussed in the text. See Supplementary Figure 3 for a color version of this figure.

