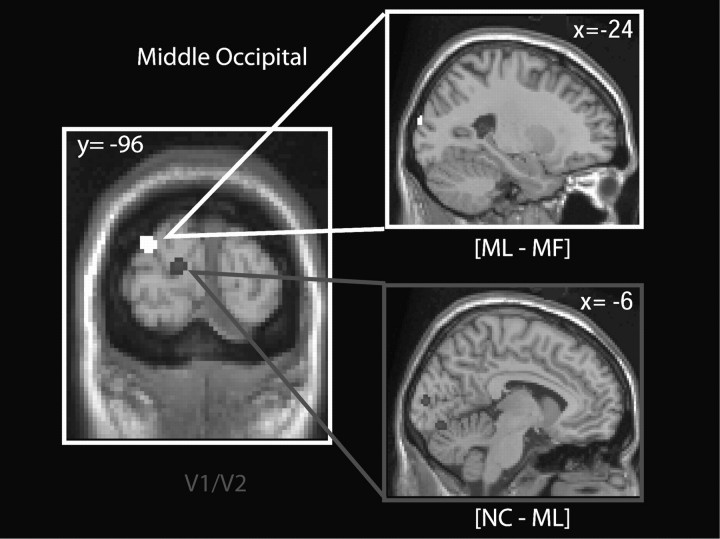
Figure 4.
Deactivations by “collinearity” and “meaning” in early visual areas. Suprathreshold regions obtained with the contrast [ML–MF] are shown in white, and those obtained with the contrast [NC–ML] are shown in gray. SPMs are displayed on coronal and sagittal slices, showing clusters in the middle occipital cortex (orange) and V1/V2 (blue). The label of V1/V2 was given using the calcarine sulcus as a landmark and the Anatomy toolbox in SPM (Eickhoff et al. 2005). All activations are shown at a threshold of P < 0.001, uncorrected. See Supplementary Figure 4 for a color version of this figure.

