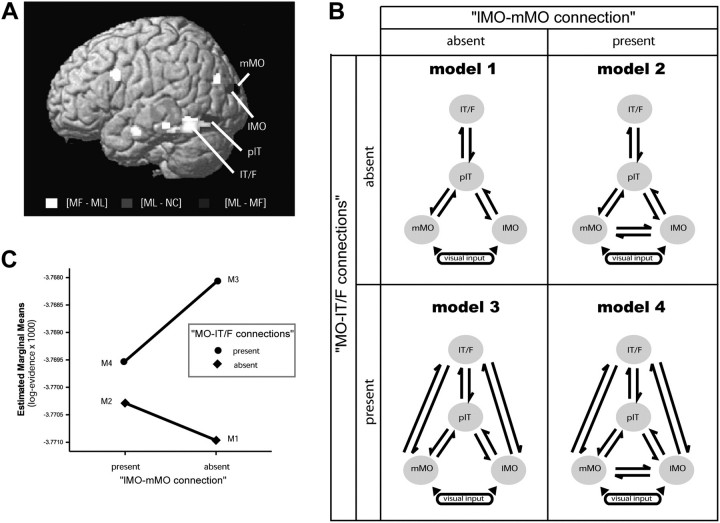
Figure 5.
DCM model comparison. (A) Location of areas included in the DCM analysis and the contrasts used to isolate them. See Supplementary Figure 7 for a color version of this figure. (B) Schematic representation of the models tested. The best model was selected using Bayesian model comparison (see Methods). The difference between the models is that they either have or do not have 1) connections between lMO and mMO (models 1 and 2) and 2) connections between MO areas and IT/F (models 3 and 4). (C) Mean log evidence averaged across subjects for each DCM model. The log evidence units are dimensionless.

