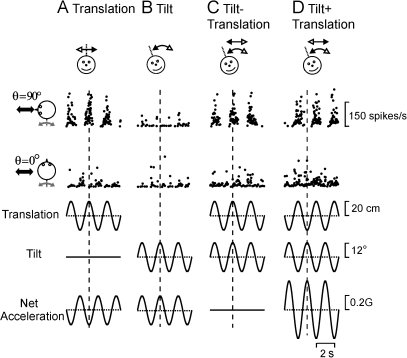
Figure 4.
Example PIVC neuron responses during combinations of tilt and translation. (A) Translation only, (B) tilt only, (C) tilt − translation, and (D) tilt + translation (0.5 Hz). Data are shown along 2 stimulation axes (cartoon drawings), with the translation/tilt position (bottom traces) being matched in both amplitude and direction to elicit an identical net acceleration in the horizontal plane. Vertical dotted lines mark the times of peak stimulus amplitude.

