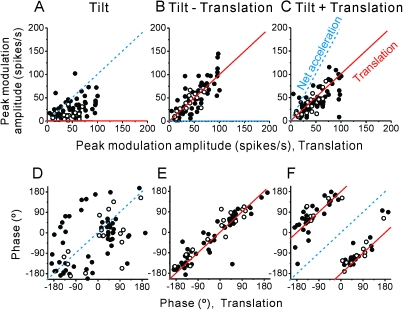
Figure 5.
Summary of tilt/translation responses. Peak response amplitude and phase during (A, D) tilt, (B, E) tilt − translation, and (C, F) tilt + translation are plotted as a function of the corresponding response during translation (0.5 Hz, n = 71). Filled symbols: convergent neurons; open symbols: nonconvergent neurons. Solid red lines indicate the predictions when cells selectively encode translation, whereas dashed blue lines illustrate the predictions of encoding net linear acceleration.

