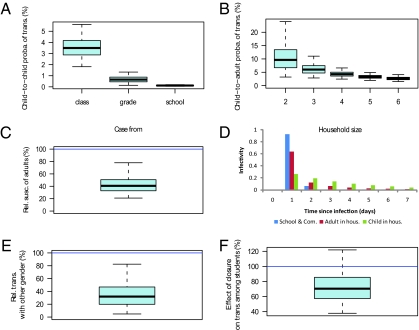
Fig. 2.
Estimated transmission risk factors and generation times in places. (A) Transmission probability from an infected student to a classmate, to a student from the same grade but a different class, and to a student from a different grade during his/her infectious period. (B) Transmission probability in the household from an infected child to an adult of the household during his/her infectious period, as a function of household size. (C) Susceptibility of adults relative to children (≤10 y old), ρadult. (D) Generation time in the school/community, in the household for adults and children. (E) Transmission to children from the other sex relative to that to children from the same sex, ρsex. (F) Transmission between students during school closure relative to that during the rest of the outbreak, ρSC. Boxplots give percentiles 2.5%, 25%, 50%, 75%, and 97.5% of the posterior distribution. The mathematical definition of parameters is given in SI Materials and Methods.

