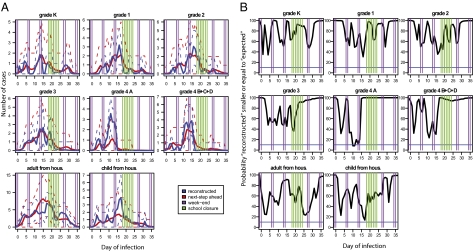
Fig. 3.
Detection of abnormal transmission events in the different groups of individuals. (A) “Reconstructed” numbers of infections per day for different groups of individuals (blue line) along with the “next-step ahead” predictions giving for each day t the number of infections predicted by the model given what has happened up to day t − 1 (red line). Dashed lines give the 95% CI. The different groups of individuals are students from grades K, 1, 2, and 3 and fourth graders from classroom A and from other classrooms (classrooms B, C, and D) and adult and child household contacts. (B) For each day and each group, the posterior probability that the reconstructed number of infections is smaller or equal to the “next-step ahead” predictions. The blue line gives the 10% limit below which adequacy is rejected. See Materials and Methods and SI Materials and Methods for details.

