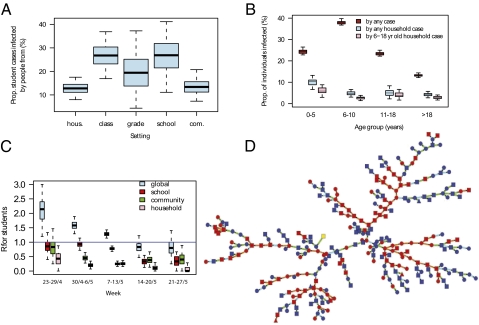
Fig. 4.
Reconstruction of the transmission tree. (A) Proportion of student cases infected by people from their household, class, grade, school, or from the community. (B) Proportion of individuals infected by any other case (red), by any household case (blue), or by a household case aged 6–18 y (pink), as a function of the age of the individual. (C) Weekly estimates of the effective reproduction number in the outbreak (“global” R) and in places (school, household, and community). (D) Reconstructed transmission tree drawn from its predictive distribution (color of the nodes, yellow, first case; red, student of the school; blue, household member of a student; color of the lines for the type of transmission, orange, among students of the school; light blue, among household members; green, in the community; shape of the nodes, circle, female; square, male; triangle, sex is missing). Boxplots give percentiles 2.5%, 25%, 50%, 75%, and 97.5% of the predictive distribution.

