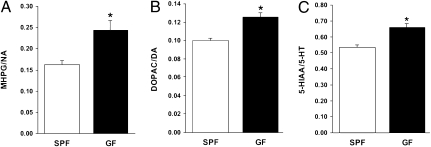
Fig. 3.
GF mice show elevated NA, DA, and 5-HT turnover in the striatum. The histograms depict the mean ratios (± SEM; n = 6 per group) for MHPG/NA (A), DOPAC/DA (B), and 5-HIAA/5-HT (C) in the striatum of male GF and SPF mice. Asterisks denote where GF mice differ significantly (P < 0.01) from SPF mice.

