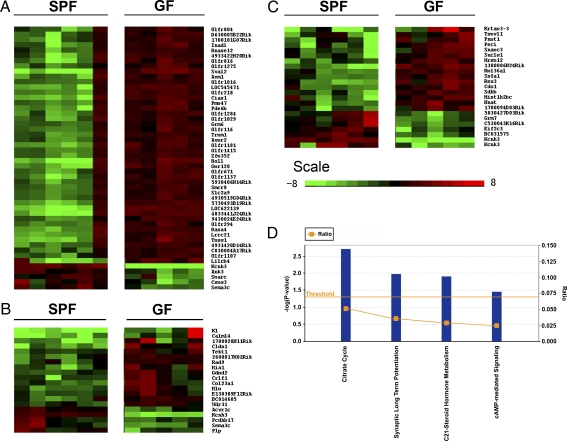
Fig. 5.
Expression profiling of GF mice and SPF mice brains. A heatmap of genes showing statistically significant (q < 5%) and fold change (>2) differences, between SPF (n = 6) and GF (n = 5) mice in the hippocampus (A), frontal cortex (B), and striatum (C). Each row represents the relative levels of expression of a single gene across all mice; each column represents the levels of expression for a single mouse. The colors red and green denote high and low expression, respectively. Differentially expressed genes were investigated for functional clustering by using Ingenuity Pathway Analysis software for canonical pathways (D), as described in Experimental Procedures.

