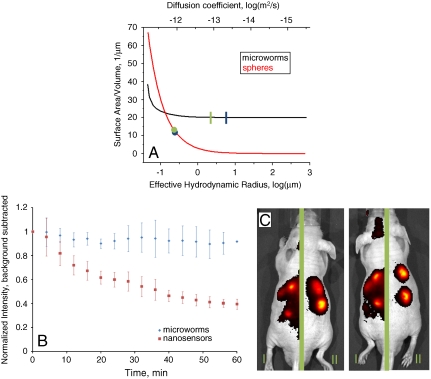
Fig. 3.
(A) The surface-area-to-volume ratio of microworms (black) and nanosensors (red) are plotted as a function of the diffusion constant, and thus hydrodynamic radius. Shown are the theoretical values for the sizes used here for microworms (blue line) and nanosensors (blue dot), as well as the experimentally measured diffusion coefficient values, green line and green dot for microworms and nanosensors, respectively. (B) Normalized fluorescent intensity of injected spots over time of microworms (blue) and nanosensors (red). Shown is the average with standard deviation for three spots of each type of particle. The decrease in the nanosensor fluorescence intensity is due to the diffusion of the nanosensors away from the injection site. Over a time range of 1 h, no significant diffusion of the microworms is observed. (C) In vivo demonstration of microworm sensors for sodium sensing. Microworms are subcutaneously located in the two injection spots on the left side of each mouse. Nanosensors are subcutaneously located in the two injection spots on the right side of each mouse. Each mouse is separated by a green bar to indicate that there were two different imaging conditions, I and II, for the two types of sensors to limit image saturation. The increased background in imaging condition I is due to the longer exposure times used to image the microworms. This method enabled imaging of both types of sensors in the presence of the autofluorescent noise.

