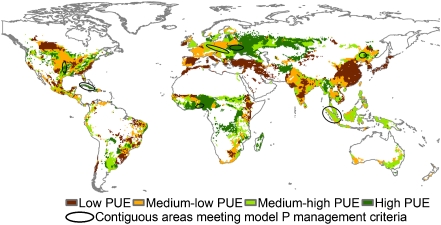
Fig. 5.
Map of total agronomic PUE (kg of crop·kg of P·input−1) for 123 crops in 2000 classified from low to high based on quartiles globally. Ovals indicate examples of contiguous areas with model P management (relatively balanced P situations, with PUE and crop production each above the global median; based on Fig. S5B).

