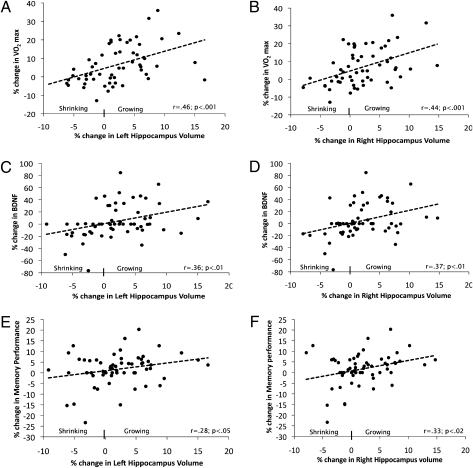
Fig. 3.
All scatterplots are of the aerobic exercise group only because it was the only group that showed an increase in volume across the intervention. (A and B) Scatterplots of the association between percent change in left and right hippocampus volume and percent change in aerobic fitness level from baseline to after intervention. (C and D) Scatterplots of percent change in left and right hippocampus volume and percent change in BDNF levels. (E and F) Scatterplots of percent change in left and right hippocampus and percent change in memory performance.

