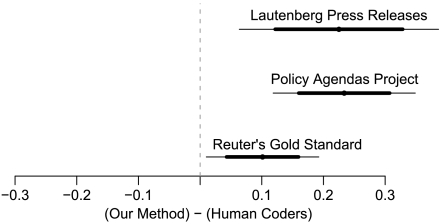
Fig. 2.
Cluster quality experiments. Each line gives a point estimate (dot), 80% confidence interval (dark line), and 95% confidence interval (thin line) for a comparison between our automated cluster analysis method and clusters created by hand. Cluster quality is defined as the average similarity of pairs of documents from the same cluster minus the average similarity of pairs of documents from different clusters, as judged by human coders one pair at a time.

