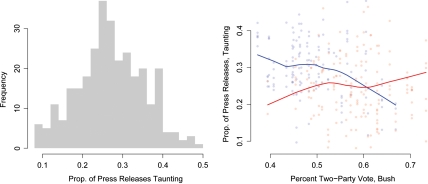
Fig. 5.
Partisan taunting hypothesis verification. The left panel shows the distribution in partisan taunting in senators’ press releases, and the right panel demonstrates that taunting is more likely when senators are in less competitive states. Each of the 301 points in the right panel represents the results of an analysis of one year’s worth of a single senator’s press releases, with blue for Democrats and red for Republicans.

