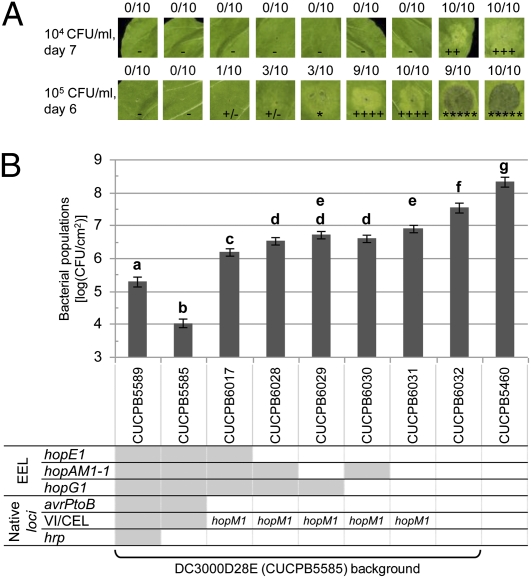
Fig. 5.
Successive PRIVAS-mediated integration of eight T3Es into DC3000D28E reveals a hierarchy contributing to chlorosis, lesion formation, and near WT growth in N. benthamiana. PRIVAS was used in programmed mode to create various combinations of hopE1, hopAM1-1, and hopG1. The resulting gene sets were integrated at the EEL of DC3000D28E derivatives CUCPB6017 or CUCPB6019, which had avrPtoB and hopM1, respectively, or the entire CEL natively restored, as indicated by white-filled cells in the genotype grid. (A) Symptoms in N. benthamiana leaves. Leaves were infiltrated with two levels of inoculum, and the plants were kept in a chamber with 70–80% relative humidity. The fraction of plants showing symptoms and the nature of symptoms scored is shown; plus sign indicates chlorosis, and asterisk indicates cell death. (B) Bacterial growth in N. benthamiana. Bacteria were inoculated at 3 × 10⁴ cfu/mL, and populations measured 6 dpi. The least-squares means ± SD of log (cfu/cm2) are shown. Means with the same letter are not significantly different using the Tukey–Kramer multiple comparisons method (α = 0.05). Eight independent experiments were performed with different subsets of the nine strains shown, with a minimum of three plants per strain in every experiment and a total of 213 data points. Randomized block design was used for data analysis using the statistical analysis program SAS.

