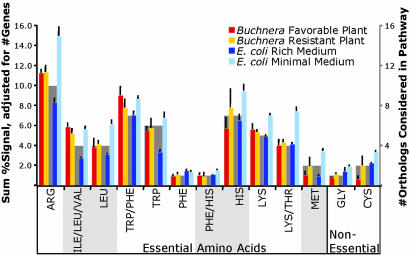
Fig. 2.
Transcript abundances of genes in essential and nonessential amino acid biosynthetic pathways. Colored bars and left y axis are average transcript signals summed for a given pathway and averaged over experimental replicates. Gray bars and right y axis show numbers of genes per pathway grouping and represent expected signal intensity based on numbers of genes. All data are for orthologs shared between Buchnera(Sg) and E. coli. ARG, argA, argB, argC, argD, argE, carA, carB, argF, argG, and argH; ILE/LEU/VAL, ilvH, ilvI, ilvC, and ilvD; LEU, leuA, leuC, leuD, and leuB; TRP/PHE, aroH, aroB, aroD, aroE, aroK, aroA, and aroC; TRP, trpE, trpD, trpC, trpA, and trpB; PHE, pheA; PHE/HIS, hisC; HIS, hisG, hisI, hisA, hisH, hisF, hisB, and hisD; LYS, dapA, dapB, dapD, dapF, and lysA; LYS/THR, thrA, asd, thrB, and thrC; MET, metE, and metF; GLY, glyA; CYS, cysE, and cysK. Block shading below the graph groups amino acid pathways as branched, aromatic, etc.

