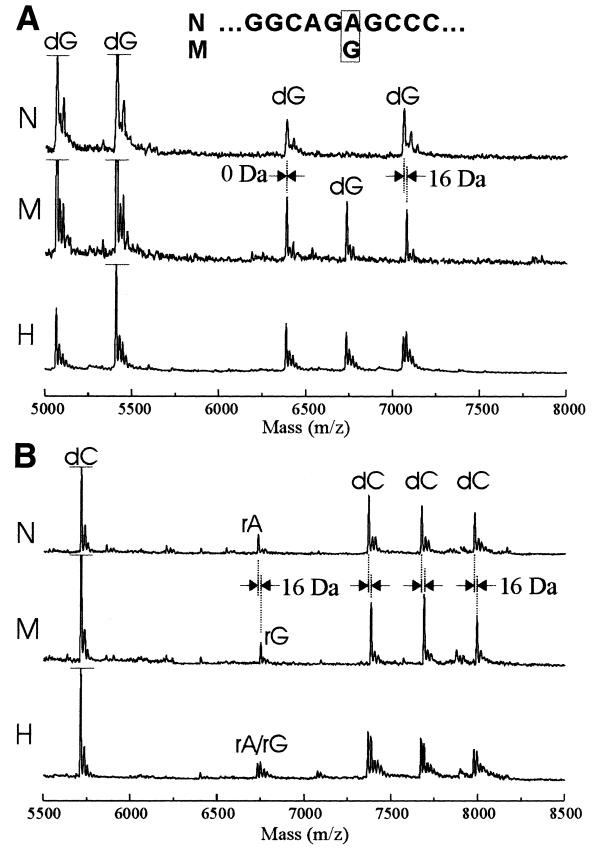
Figure 3.
Mass spectra for the detection of A→G variation. Sequencing reactions of a region involving the MELAS syndrome mutation were performed using nicked SP6 RNA polymerase and analyzed by MALDI-TOF MS. Only a portion of mass spectra of (A) G-specific and (B) C-specific reactions around the mutation is shown. The top (N) and middle (M) spectra in both panels show normal (A-allele) and MELAS (G-allele) samples, respectively. The bottom (H) spectra show a 1:1 mixture of the two samples. The major dG and dC peaks of N, M and H samples in the range 5000–5750 Da are shown as cut off in height (to reduce wasted background space in the graphs), except for the dG peak of H sample near 5000 Da position.

