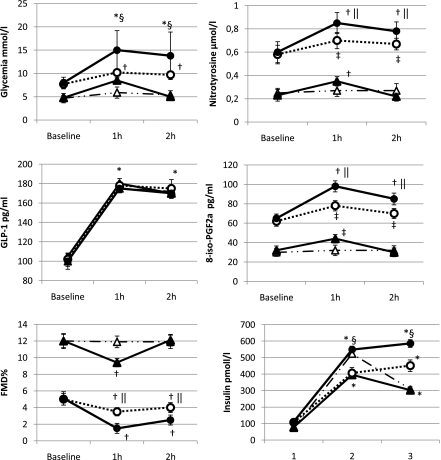
Figure 1.
Changes of glycemia, GLP-1, FMD, plasma nitrotyrosine, 8-iso-PGF2a, and insulin during the meal and the OGTT in normal healthy control subjects and type 2 diabetic patients. Data are expressed as mean ± SE; △, meal test controls; ▲, OGTT controls; ○, meal test type 2 diabetes; ●, OGTT type 2 diabetes; *P < 0.001 vs. basal; †P < 0.01 vs. basal; ‡P < 0.05 vs. basal; §P < 0.01 vs. OGTT; ||P < 0.05 vs. OGTT.

