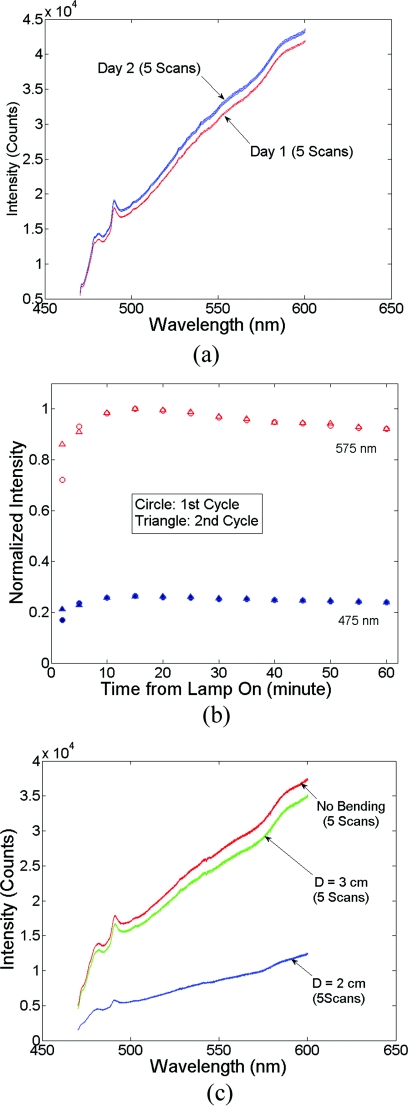
Figure 3.
Sources of instrumental errors. (a) Day-to-day lamp intensity fluctuations measured with SC probe B. Each color represents five consecutive scans per day from each of two days. (b) Lamp intensity fluctuations during a 60-min warm-up period normalized to the maximum intensity at 575 nm. (c) Intensity attenuation induced by fiber bending loss measured with SC probe B. Each color represents five consecutive scans under the same bending diameter. All of these measurements were made on a Spectralon reflectance standard with high scan only. (Color online only.)

