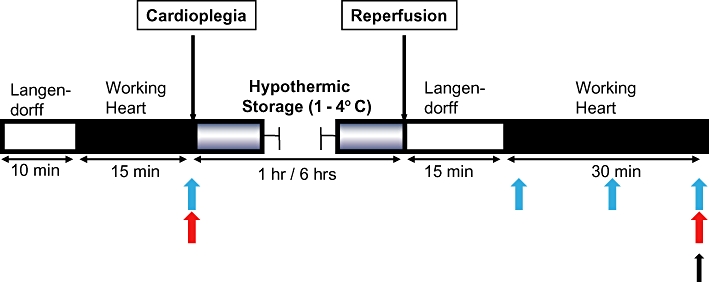
Figure 1.

Experimental timeline. Blue arrows indicate times at which coronary effluent were collected; red arrows indicate times when measurement of cardiac functions were made; black arrow indicates the time point at which heart tissue was collected for Western blot and immunohistochemical analyses.
