
Figure 1.
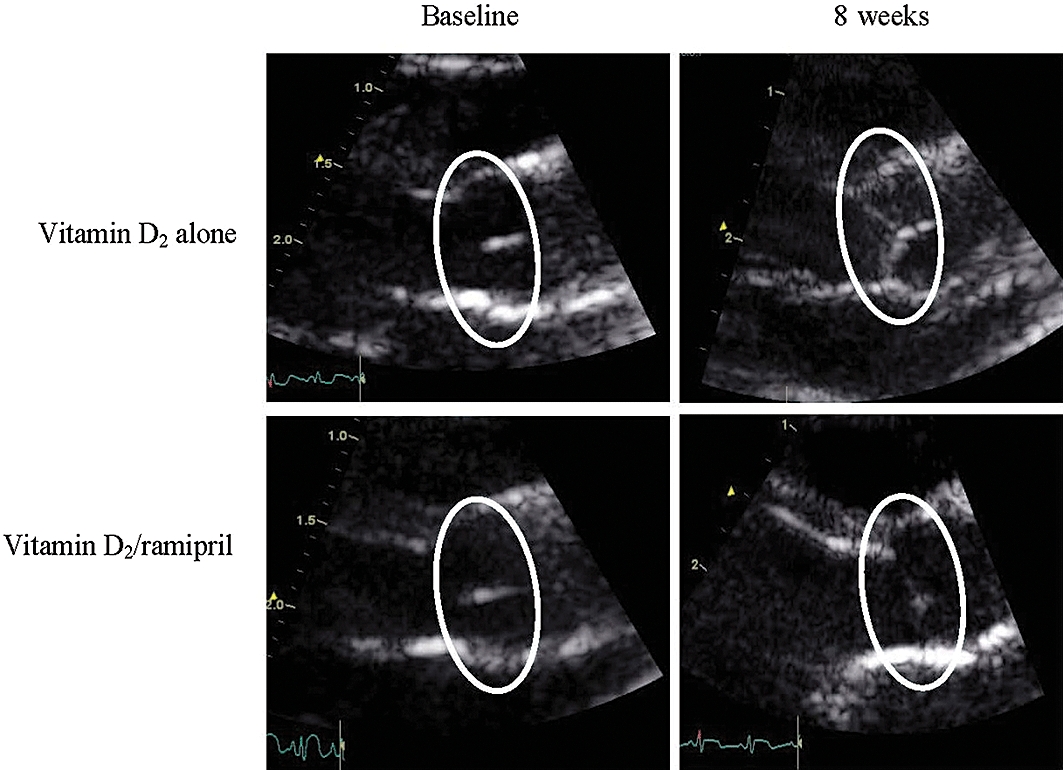
Echocardiographic views of rabbit aortic valves at baseline and after 8 weeks of treatment. Zoom pictures (2 cm) of parasternal-like long axis view of AV leaflets. Typical examples for vitamin-D2 group and vitamin D2/ramipril groups are shown at baseline and after 8 weeks. Regions of interest show position of valve. Note increased echogenicity in the vitamin D2 group (in comparison with vitamin D2/ramipril valves) at 8 weeks.