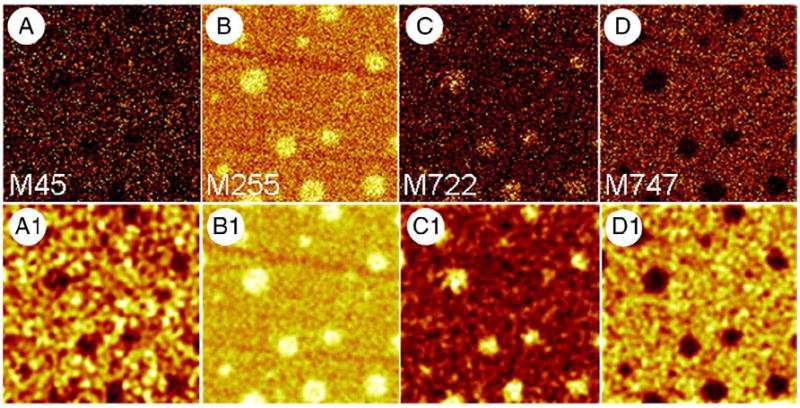
Fig. 4.

ToF-SIMS images of a BLES LB film supplemented with 20 mol% 15N-miniB compressed to a surface pressure of 30 mN/m and transferred onto gold-coated mica by conventional Langmuir–Blodgett technique. A–D are SI maps showing the distribution of M45 ( ) specific to 15N-miniB, M255 (palmitate), M722 (DPPG−) and M747 (POPG−). Images shown in A1–D1 were obtained by subjecting A–D to a smoothing function available as part of the ION-TOF software to increase contrast. All images are 50×50 μm2, 256×256 pixels with 1 shot/pixel.
