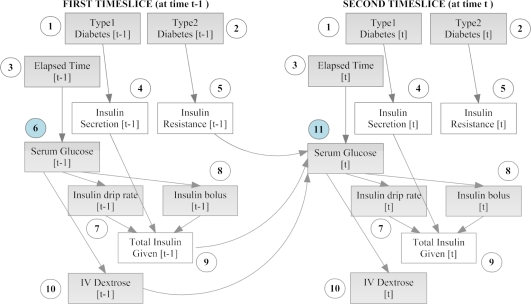
Figure 1.
DBN model for serum glucose control and insulin dosing in the ICU. Two timeslices are shown here – the model is automatically expanded (unrolled) by Projeny for as many timeslices present in each patient’s data. Observed nodes are shaded, hidden nodes are clear. Numbers within circles denote equivalence classes obtained through parameter tying (see section 3.5).

