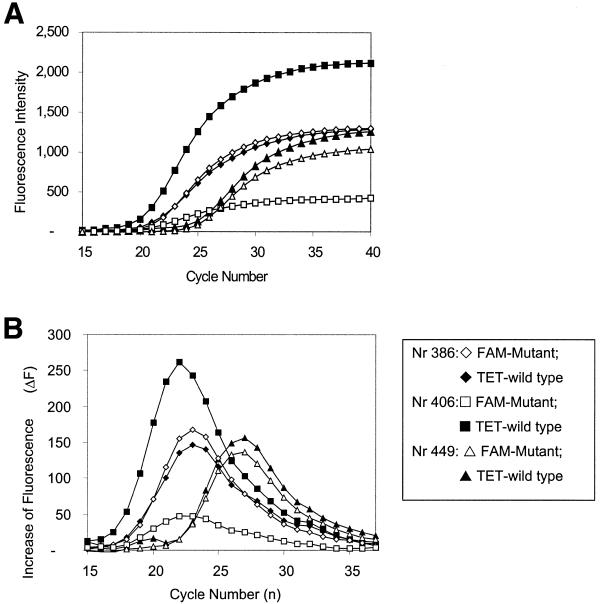
Figure 2.
Real time, duplex Molecular Beacon A8334G PCR of patient DNA samples. (A) The FAM-labeled mutant (open symbols) and the TET-labeled wild-type Molecular Beacon (filled symbols) amplification patterns are displayed simultaneously. (B) The first derivatives of the amplification curves. Differences in curve height indicate the heteroplasmy differences, while the relative position to the PCR cycle number reflects the differences in mtDNA copy number. (Sample 386 and 449 derived from muscle and lymphocyte, respectively.)

