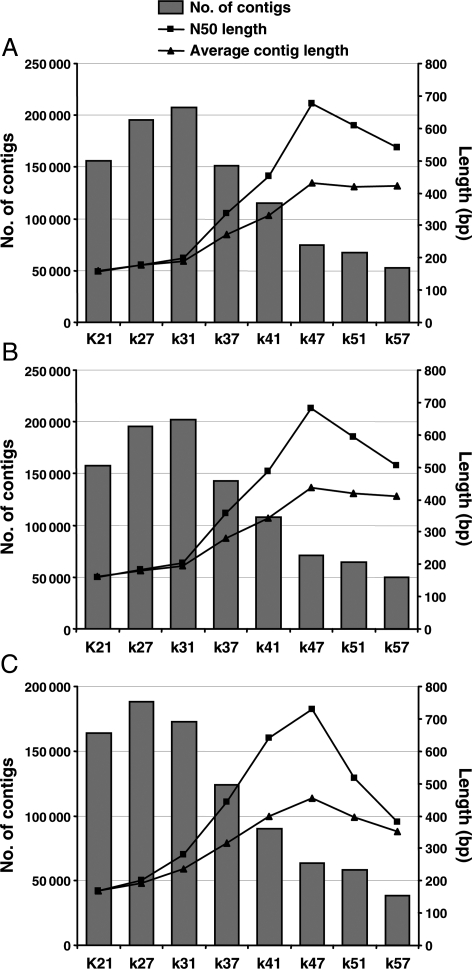
Figure 1.
Comparison of de novo assembly of three data sets using Velvet program as a function of k-mer length. The three data sets include (A) untrimmed data set (72 bp PE and 51 bp SE reads), (B) trimmed data set 1 (70 bp PE and 50 bp SE reads) and (C) trimmed data set 2 (65 bp PE and 50 bp SE reads). The bars indicate number of contigs 100 bp or longer (left axis). The lines indicate N50 length (rectangles) and average contig length (triangles) in bp (right axis).

