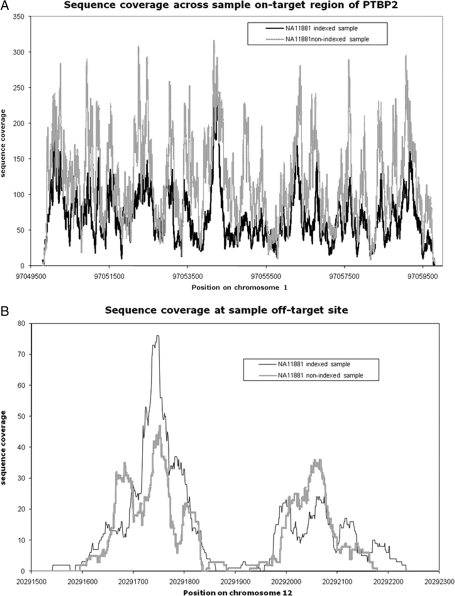
Figure 2.
Sequence coverage across on-target and off-target regions. Sequence coverage is plotted for the single non-indexed and indexed samples at an on-target site (PTBP2 on chromosome 1; A) and at an off-target site (chromosome 12; B). Inclusion of the index does not dramatically change the pattern of sequence coverage at on-target or off-target regions. The higher sequence coverage observed for the non-indexed sample compared with the indexed sample reflects the larger number of clusters that passed QC filtering during the sequence run (Supplementary Table SB).

