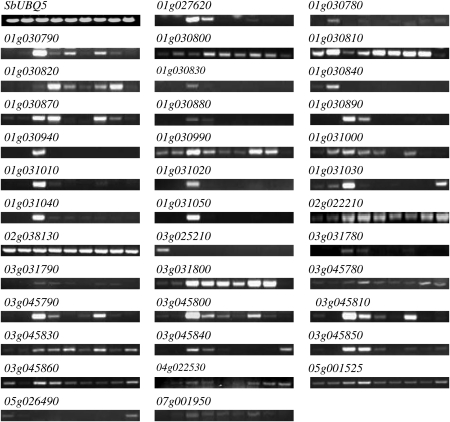
Figure 4.
Transcript profiles of the sorghum Tau class of GST superfamily members in nine different sorghum tissues shown by RT–PCR analyses. Nine bands from left to right for each gene represent amplified products from young leaves, mature leaves, young roots, mature roots, young panicles, mature panicles, young seeds, mature seeds and stems, respectively. The amplification of the gene SbUBQ5 with the locus name Sb09g004630 was used as control in this study as this gene showed the similar expression level among different tissues or under various stresses in this study.

