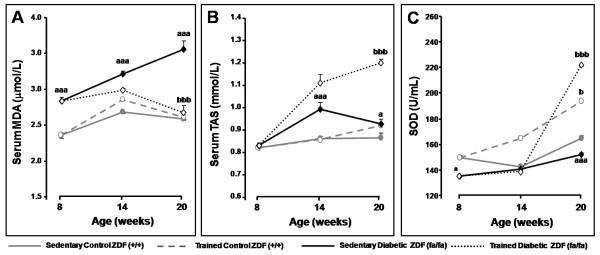
Figure 1.
Evolution of serum MDA (A), TAS (B) and blood SOD (C) levels between T0 and Tf in control (+/+) and diabetic (fa/fa) Zucker diabetic fatty rats: control sedentary (black circles), control exercised (white circles), diabetic sedentary (black diamonds) and diabetic exercised (white diamonds) . Data are means ± sem of eight separate values (rats) per group. Statistical significance: aaa P < 0.05: sedentary diabetic vs sedentary control; bP < 0.05 and bbbP < 0.001: exercised control or diabetic vs sedentary control or diabetic, respectively. MDA, malondialdehyde; SOD, superoxide dismutase; TAS, total antioxidant status. Adapted from [32].

