
Figure 2.
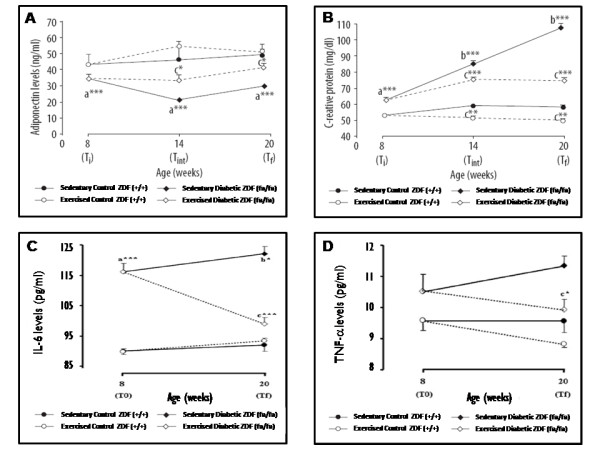
Evolution of serum adiponectin (A), C-reactive protein (B), IL-6 (C) and TNF-α (D) levels between T0 and Tf in control (+/+) and diabetic (fa/fa) Zucker diabetic fatty rats: control sedentary (black circles), control exercised (white circles), diabetic sedentary (black diamonds) and diabetic exercised (white diamonds). Data are means ± sem of eight separate values (rats) per group. Statistical significance: a fa/fa versus +/+; b Tf versus T0; c exercised rats versus sedentary rats; *P < 0.05, **P < 0.01 and ***P < 0.001. IL-6, interleukin 6; T0, initial time; Tf, final time; TNF-α, tumor necrosis factor-α. Adapted from [[33] and [[34]].