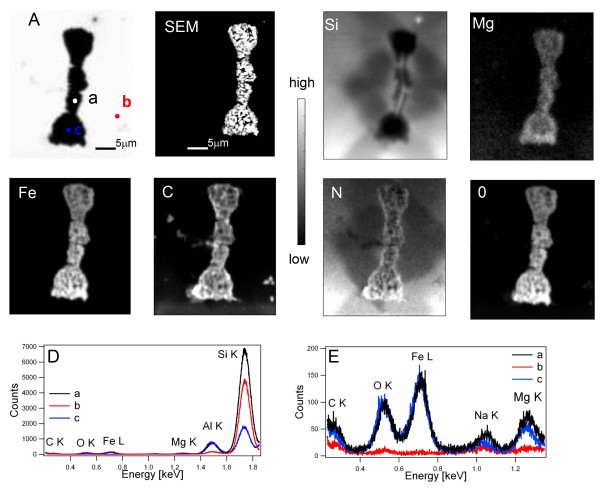
Figure 2.
Soft X-ray microscopy and XRF analyses on an extracted asbestos body. The images show the analyses of an extracted asbestos body deposited on a Si3N4 window. Panel A: X-ray absorption image acquired at 1.935 keV (40× 48 μm2 area, 20 ms dwell time, 500 nm spot size). Panel SEM: SEM image of the same asbestos body. Panels Mg, Si, Fe, N, O and C: XRF maps acquired at 1.935 keV with 6 s/pixel dwell time (Si and Mg) and at 0.9 keV (Fe, N and O) with 4 s/pixel dwell time, both with 500 nm spot size. Panel D and E: XRF spectra collected on the points indicated in panel A at 2 keV and 1.4 keV respectively (30 s acquisition time).

