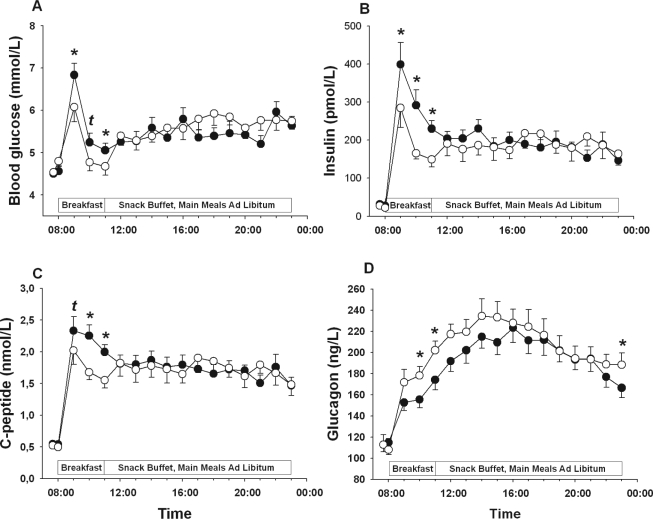
Figure 1.
Mean (± SEM) concentrations plasma glucose (A), serum insulin (B), serum C-peptide (C), and plasma glucagon (D) during an experimental day following 2 nights of 8 h of sleep each (white bars/circles) and 2 nights each containing 4 h of sleep (black bars/circles), respectively. N = 15; tP < 0.10; *P < 0.05.

