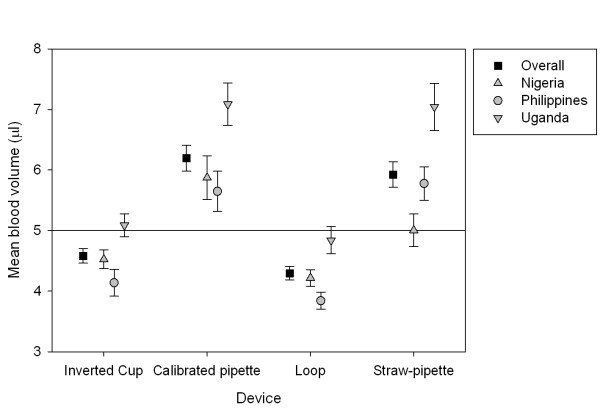
Figure 2.
Blood volumes transferred by each device. Squares, triangles and circles represent total and site-specific mean average volumes. Whiskers represent 95% confidence intervals. NB: The glass capillary is excluded from this analysis because the filter paper surface used in this study does not consistently draw blood from the capillary device, and consequently the resulting blood spots do not accurately reflect its transfer volume.

