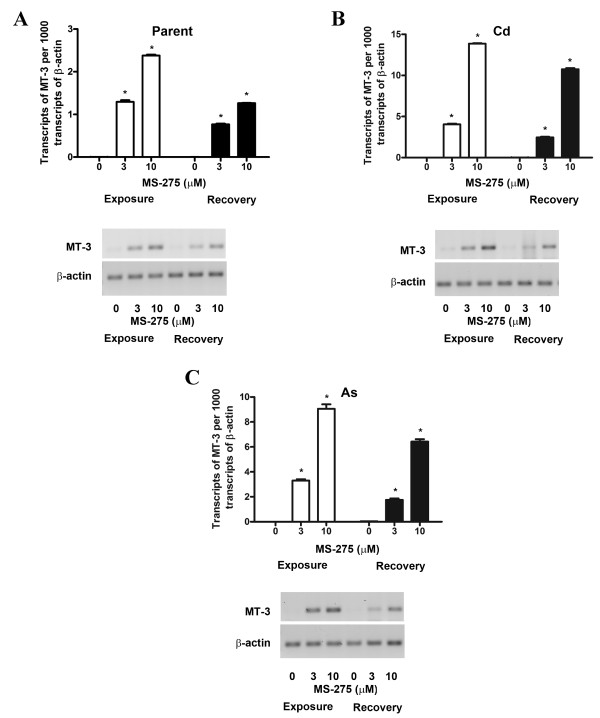
Figure 2.
Expression of MT-3 in parent, Cd+2 and As+3 transformed cells after removal of MS-275. Cells were cultured with 10 μM MS-275 until they reached confluency after which the drug was removed and the cells were allowed to recover for 24 h following which RNA was extracted from the recovered cells. A. RT-PCR analysis of MT-3 expression in UROtsa parent cells. B. RT-PCR analysis of MT-3 expression in Cd+2 transformed UROtsa cells. C. RT-PCR analysis of MT-3 expression in As+3 transformed UROtsa cells. Graphs represent real time RT-PCR data whereas ethidium bromide stained gels show the semiquantitative PCR analysis data. The expression of MT-3 was normalized to that of β-actin. The determinations were performed in triplicates and the results shown are the mean ± SE.*Statistically significant compared to untreated control cells.

