
Figure 12.
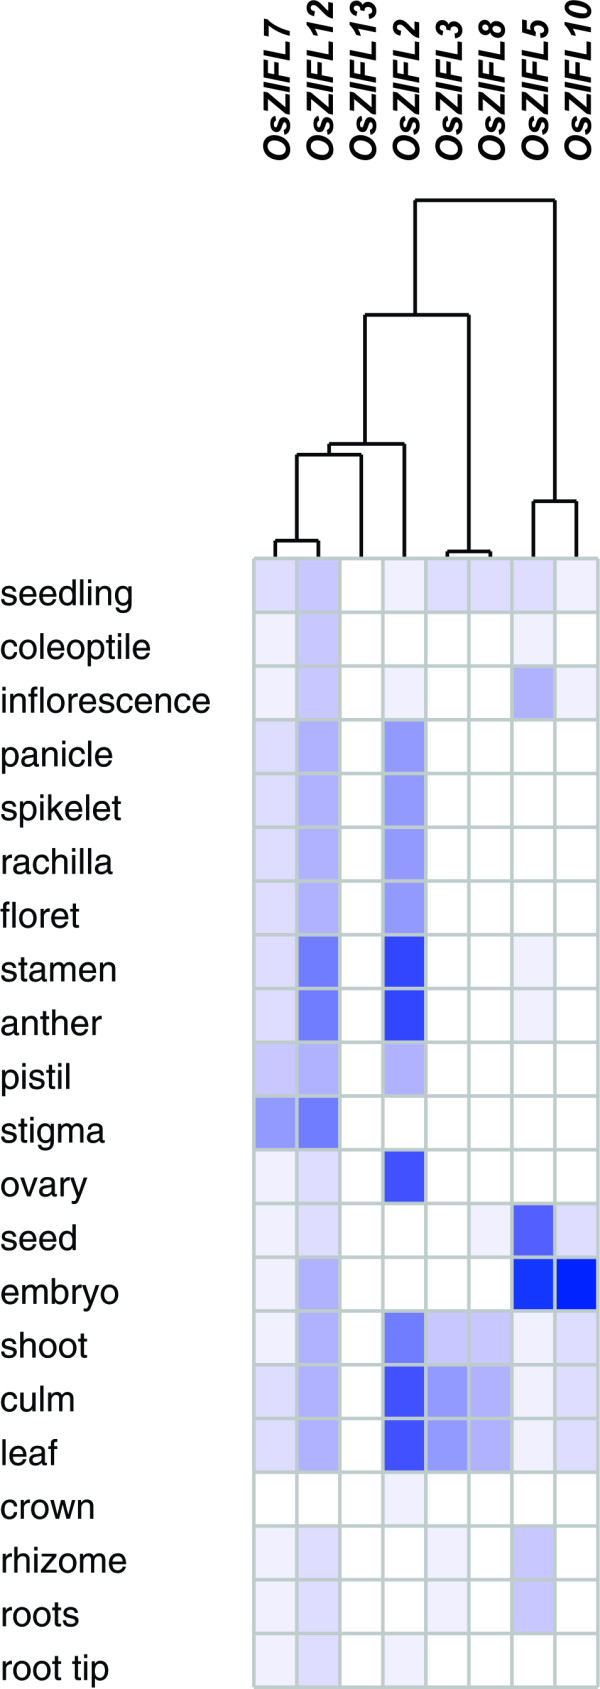
OsZIFL2, OsZIFL3, OsZIFL5, OsZIFL7 OsZIFL10, OsZIFL12 and OsZIFL13 gene expression data obtained using Genevestigator, and based on Affymetrix specific probes. All available high quality arrays on rice organ-specific expression were used. All data from arrays showing expression under diverse treatments or from mutant/transgenic plants were kept out. Expression level is denoted by intensity of blue color. Organ names are given at left.