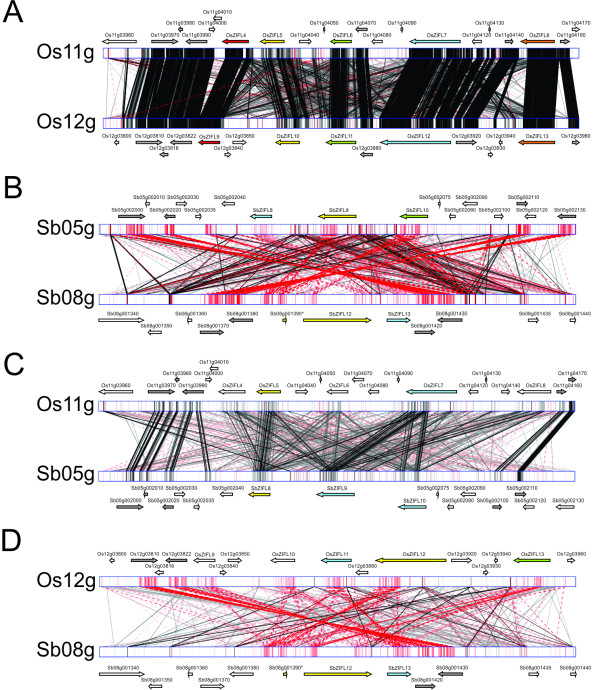
Figure 3.
Genomic alignment obtained with the GATA tool using 100 kb regions containing rice or S. bicolor ZIFL genes. Black lines indicate a direct match, while red lines indicate an inverted match. Gene positions and orientations are denoted by arrows. ZIFL genes marked with the same color in both species indicate the closest homologs. Duplicated non-ZIFL genes are shown in gray. (A) Rice chromosomes 11 and 12. (B) S. bicolor chromosomes 5 and 8. (C) Rice chromosome 11 and S. bicolor chromosome 5. (D) Rice chromosome 12 and S. bicolor chromosome 8.

