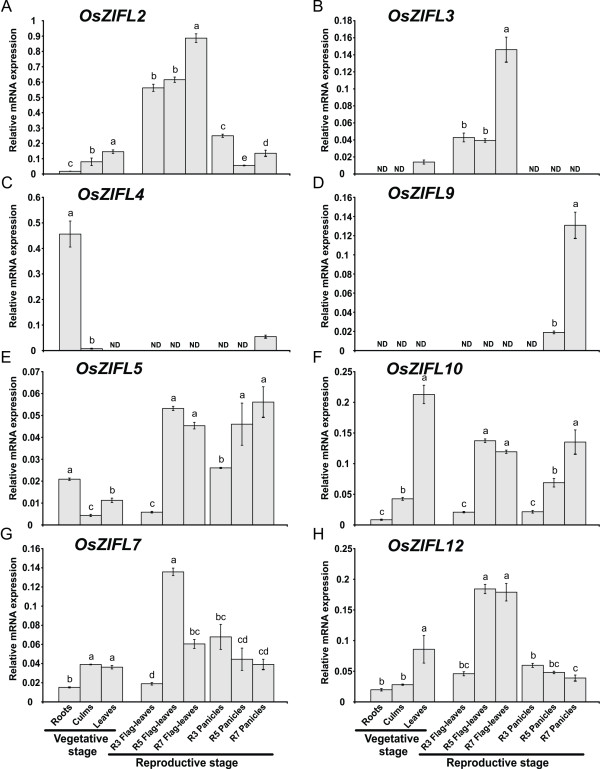
Figure 6.
Expression of OsZIFL genes in roots, culms and leaves during vegetative growth and flag leaves and panicles during reproductive growth, evaluated by qPCR. Reproductive stages analyzed were R3 (panicle exertion), R5 (grain filling) and R7 (grain dry-down) from both flag leaves and panicles. (A) OsZIFL2. (B) OsZIFL3. (C) OsZIFL4. (D) OsZIFL9. (E) OsZIFL5. (F) OsZIFL1. (G) OsZIFL7. (H) OsZIFL12. Values are the averages of three samples ± SE. Different letters indicate that the mean values are different by the Tukey HSD test (P ≤ 0.05).

