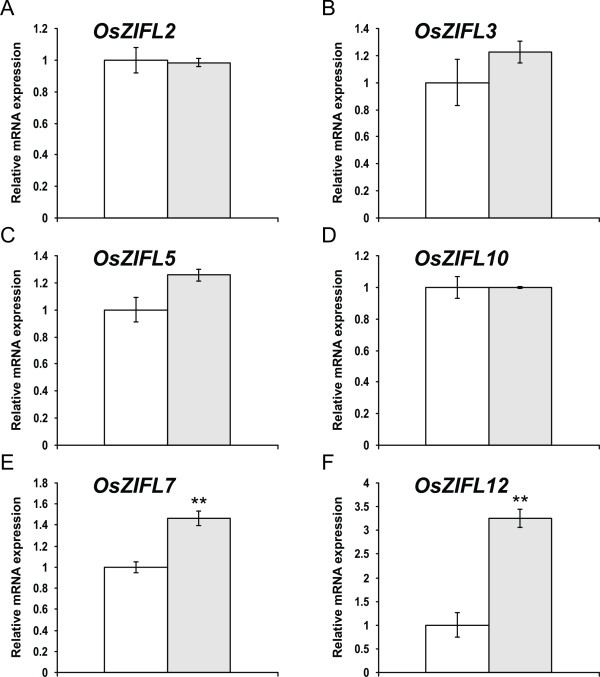
Figure 9.
Gene expression in leaves of rice plants submitted for 3 days to 0.5 μM of Zn (control, white bars) or 200 μM of Zn (Zn+, gray bars), evaluated by qPCR. (A) OsZIFL2. (B) OsZIFL3. (C) OsZIFL5. (D) OsZIFL10. (E) OsZIFL7. (F) OsZIFL12. Values are the averages of three samples ± SE. Statistical differences according to the Student's t-test in comparison to control are shown by one (p ≤ 0.05) or two asterisks (p ≤ 0.01).

