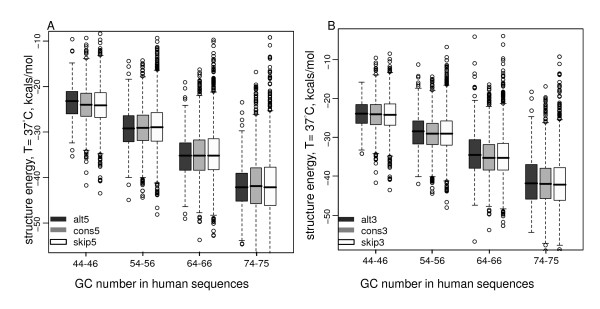
Figure 4.
GC content difference explains structural stability difference. Boxplots of the energy are plotted (dots represent outliers). Alternative, constitutive, and skipped splice sites in humans had similar stability given the similar GC number (Wilcoxon tests for splice site energy comparison within each GC group, P > 0.05).

